

Team Velocity Is “Just Numbers”
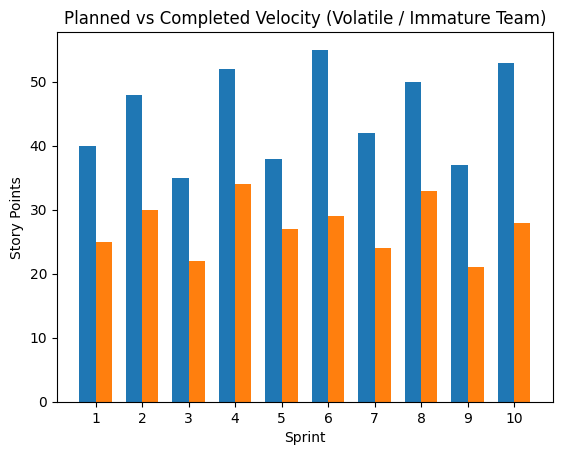
In my previous article, I wrote about burn down charts and the role they play in delivery.
This is a continuation of that discussion.
One of the three well known obstacles to scale is lack of systems and structure. Most organizations do not notice it early, because growth hides structural weaknesses. Only when complexity increases does the absence of structure become visible.
“Velocity Is Useless.”
I have heard the sentence countless times: “Velocity is useless. It’s just numbers.”
It usually surfaces when delivery feels unstable, when deadlines slip, or when planning conversations turn into long explanations of why this sprint was different.
Velocity is numbers, and that is precisely why it matters.
Revenue is numbers, Churn is numbers, Runway is numbers, We rely on them because they show us how the system behaves over time. Delivery capacity is no different.
What the Chart Reveals
A velocity chart does not change how fast a team works. It does not repair architecture or replace leadership decisions.
What it does is make behavior visible across time.
Without historical data, every sprint stands on its own. Each shortfall has a reason. Each delay feels situational. Each commitment seems reasonable in isolation.
I have seen planning meetings where an entire hour was spent debating whether the last sprint was “special” instead of looking at the last six sprints on the wall. The debate felt productive, however the pattern was ignored.
With historical data, patterns start to surface. Stability or volatility becomes visible. Overcommitment stops being a one-off event and starts becoming a trend. Improvement, if it exists, can be seen. Repetition becomes harder to defend.
The value is not in the number itself, the value is in the pattern the numbers create.
Energy Has Limits
In early stage companies, proximity compensates for missing structure. Teams are small. Communication is direct and corrections happen quickly.
At ten people, informal coordination works. At fifty, informal becomes interpretation. At one hundred, it becomes politics.
As the organization grows, dependencies multiply. Assumptions travel further. Small estimation gaps compound across teams. Informal corrections no longer reach everyone who depends on them.
At that point, memory becomes more important than enthusiasm.
Velocity tracking is one simple mechanism for building memory into delivery. It allows the organization to observe how it behaves rather than how it hopes to behave.
The questions it raises are practical:
- Are we consistent?
- Are we drifting?
- Are we systematically overcommitting?
- Are we learning from previous cycles?
These questions are uncomfortable because they shift the conversation from narrative to evidence.
Growth Under Pressure
As organizations grow, existing ways of working are put under pressure.
Practices that were manageable when ten people sat in the same room become harder to sustain when there are thirty, fifty, or more. Planning assumptions travel further. Small estimation gaps compound across teams. Informal corrections no longer reach everyone who depends on them.
Growth does not create these weaknesses; it exposes them.
If planning has been optimistic, the cost of that optimism increases. If feedback loops are slow, delays propagate further before anyone reacts. If structure is inconsistent, variability shows up in delivery timelines.
What scales is not effort alone, but the system that organizes it.
Systems need feedback to adjust. A chart is one structured way of providing that feedback.
When Velocity Feels Irrelevant
Sometimes velocity feels irrelevant.
Often the data is accurate. The issue is that it has no consequence. The numbers are visible, yet planning and commitments proceed exactly as they did before.
If commitments are still set by confidence in the room rather than by historical capacity, the chart becomes decoration.
In those situations, velocity is present but unused. Forecasts are shaped by ambition. Adjustments are reactive rather than deliberate. The organization gathers data without letting it influence behavior.
When velocity becomes part of planning, the tone changes. Forecasts are grounded in previous output. Variability is acknowledged instead of explained away. Instability becomes visible early, while correction is still manageable.
Beyond the Chart
Velocity illustrates a broader principle about how organizations mature.
Clear ownership, defined decision frameworks, explicit Definition of Done, and capacity planning grounded in evidence all serve the same purpose: they reduce randomness and make behavior predictable.
Lack of systems and structure remains one of the most common obstacles to scale because randomness is tolerable in small organizations and destructive in larger ones.
Structure does not slow growth. It makes outcomes repeatable.
The Real Question
The relevant question is not whether velocity is useful, but whether the organization learns from its own behavior.
- Does it build institutional memory?
- Does it adapt based on patterns?
- Does variability decrease over time?
Or does each sprint begin as if the previous one did not happen?
Velocity charts do not create performance; they reveal consistency.
Scale begins the moment consistency becomes intentional.