

Struggling With SaaS Delivery? You Might Be Ignoring Your Burn-Down Chart
Over the past few weeks, in discussions and meetings across different teams and organizations, one pattern has repeated itself.
The burn-down chart comes up, and almost immediately, someone says:
“We use boards.”
“We use Jira.”
“We use Azure DevOps.”
Then the follow-up:
“We’re not really using burn-down charts.”
“We don’t see the value.”
“Velocity is just numbers.”
And the conversation moves on.
But when you stay in the discussion a little longer, something becomes clear.
It’s not resistance, It’s misunderstanding how to use it…
If You Struggle to Deliver on Commitments, This May Be the Place to Start
Across the discussions I’ve had, one theme keeps surfacing:
Teams struggle to consistently deliver what they commit to.
Not occasionally.
Systemically.
Deadlines slip.
Scope shifts late.
Quality gets compressed.
Stakeholders are surprised.
And yet, when we look at the tooling setup, everything appears mature.
Boards are in place.
Jira is configured.
Azure DevOps is running.
Sprints are planned.
But burn-down charts are not being used, and even worse, they exist but no one looks at them.
If you struggle to deliver on commitments, this may be the place to start.
Not because burn-down charts magically fix delivery, because they force an early confrontation with reality.
What Actually Happens in Most Sprints
Let’s describe a normal sprint that does not actively use burn-down as a steering mechanism.
Day 1–3
Stories are started. Energy is high.
Day 4–6
Many items are “in progress.”
Very few are done.
Day 7
Someone says, “We might be tight.”
Day 9
Scope negotiation.
Stress.
Shortcuts.
Escalations.
And at the review:
“We underestimated.”
Maybe.
Or maybe the system never forced the right conversation early enough.
The Moment That Changes Everything
Delivery problems rarely begin at the end of the sprint.
They begin around day three.
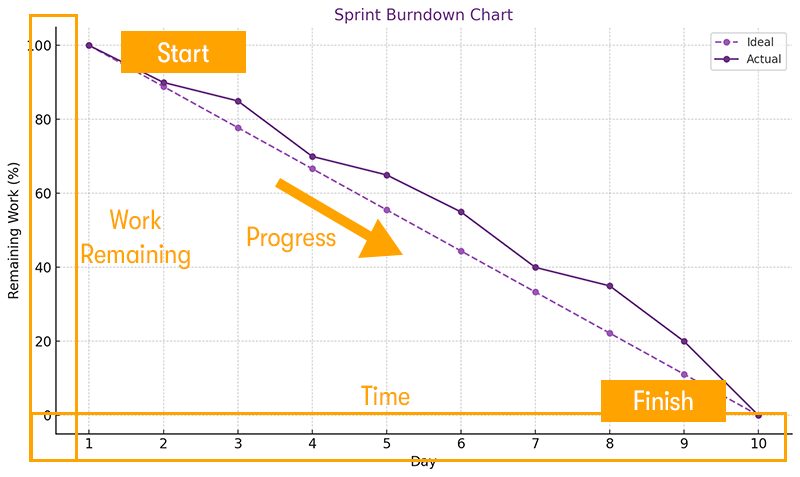
That is when the actual trend line quietly starts drifting above the ideal line.
And nothing happens…
No conversation, No scope adjustment, No escalation of blockers and No re-prioritization.
Just silent optimism…
By the time the discomfort becomes visible in conversation, the system has already accumulated risk.
The burn-down chart is not valuable because it shows deviation, It is valuable because it shows deviation early enough to act.
The Question Most Teams Never Ask
When the trend line is above ideal, the question is not:
“Who misestimated?”
The question is:
“What decision are we postponing?”
Because when burn is slow, one of these is usually true:
- Work items are too large to finish early.
- Too many things are started.
- A dependency is not resolved.
- Scope is misaligned with capacity.
- The wrong work was prioritized.
And unless that conversation happens when the signal appears, the sprint outcome is already being shaped.
Burn-Down as a Commitment Integrity Tool
Commitment is not protected by motivation, It is protected by feedback loops.
A burn-down chart creates a daily integrity check between:
What we said we would deliver, and what the system is currently capable of delivering.
If that integrity gap is not visible, it will surface later as stress.
If it is visible early, it becomes a leadership moment.
What Changes in Standups
Instead of:
“What did you do yesterday?”
The standup becomes:
“We are trending above ideal. What needs to change today?”
That subtle shift:
- Encourages finishing before starting.
- Forces surfacing of hidden blockers.
- Engages product earlier in de-scoping.
- Builds collective ownership of trajectory.
Most importantly, it shifts the team from reporting work to managing delivery risk.
How to Actually Use a Burn-Down Chart
Most teams have burn-down charts enabled, very few actively use them.
Here is a practical way to integrate them into your daily work.
1. Before the Sprint Starts
- Ensure all committed work is estimated and included in the sprint scope.
- Agree on what “done” means.
- Make sure the total story points reflect the actual commitment.
The burn-down is only meaningful if the starting point reflects reality.
2. During the Sprint — Daily Standup Usage
Start the standup by looking at the burn-down.
Ask three questions:
- Are we above, on, or below the ideal line?
- If above, what specifically is causing it?
- What decision do we make today because of this?
If the line is above ideal:
- Swarm to finish instead of starting new work.
- Break large stories into smaller deliverable slices.
- Escalate blockers immediately.
- Involve product early to consider de-scoping.
The rule is simple:
If the trend changes, behavior must change.
3. Mid-Sprint Course Correction
If by mid-sprint the trend is clearly above ideal, explicitly decide:
- What will not be delivered?
- What must be protected at all cost?
- Who needs to be informed now, not later?
Do not wait for the end-of-sprint review to negotiate scope.
Burn-down charts are early-warning systems.
Use them while you still have options.
4. In Boardwalks
When leadership reviews the board, combine ticket view with trajectory view.
Instead of asking:
“Why is this ticket still open?”
Ask:
“We are trending above ideal, what support do you need?”
The burn-down shifts leadership from inspection to enabling flow.
5. In Scrum of Scrums
Look for patterns across teams:
- Are multiple teams consistently above ideal?
- Are dependencies causing recurring slow burn?
- Is scope stability a systemic issue?
Burn-down at scale reveals structural problems, not individual ones.
What It Teaches Over Time
If used consistently, burn-down charts train teams to:
- Finish before starting new work.
- Reduce parallel work and context switching.
- Surface blockers early
- Protect commitment integrity.
- Improve predictability.
They are not about control, They are about feedback.
And teams that build strong feedback loops do not rely on optimism,
they rely on evident progress